Integrity Sales Group
Brochure site and operations dashboard
A marketing site for a New Zealand sales and merchandising agency, and an internal dashboard that turns field visits and sales data into something the team can act on.
integritysalesgroup.co.nz- Client
- Integrity Sales Group
- Year
- 2026
- Role
- Designer and developer (through Bizbo)
- Discipline
- Web design, Development, Data dashboards
- Tools
- Next.js, Tailwind, shadcn/ui, Postgres, Clerk, Repsly API, Claude
Overview
Two products for one client
Integrity Sales Group helps New Zealand food, beverage and product brands get onto supermarket shelves and stay there, with hands-on sales, merchandising and compliance support across Foodstuffs, Woolworths and beyond.
I designed and built their public website, then followed it with an internal dashboard for the team. Both run on Vercel with no CMS: content and configuration live in code.
Brochure site
Your product deserves prime shelf space
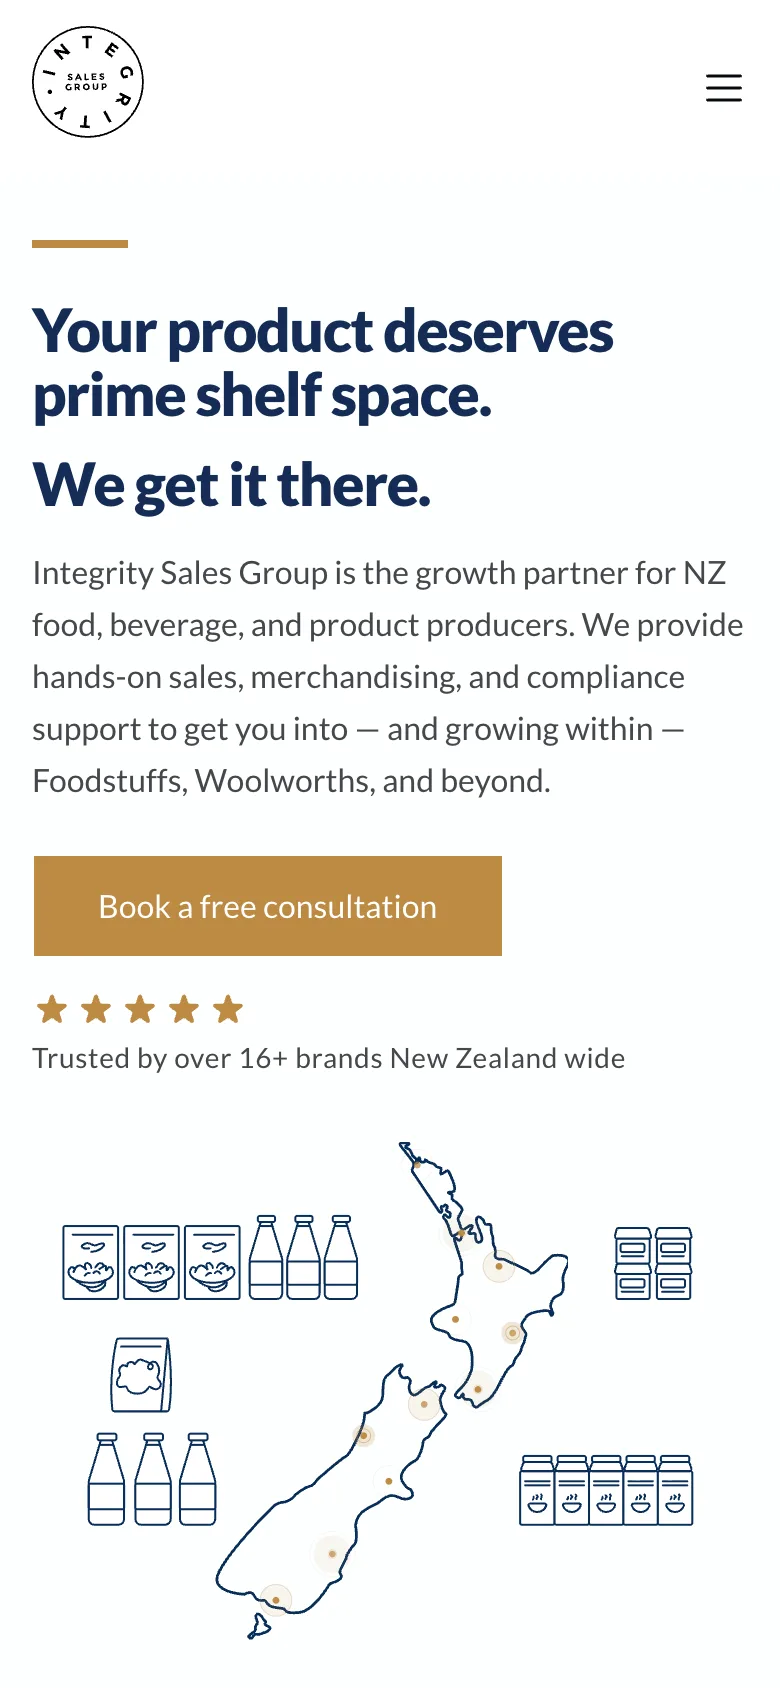
The site leads with one clear promise and a single call to action: book a consultation. Hand-drawn line illustrations of New Zealand and the supermarket shelf carry the story, with client logos, a process section, testimonials and booking built in.

Dashboard
From field visits to decisions
Reps log store visits in Repsly. The dashboard pulls that data into Postgres and lays it out by brand, store and person, alongside sales figures and monthly targets. Staff sign in with their company Google account.
- Overview: rep activity this week, target store progress, sales trend and the brands rising and falling.
- Brands and stores: cards and tables for every brand, with store coverage, visits and sales.
- Store matrix: which stores each brand is ranged in, as a checklist the team can work through.
- Team: visits, stores and hours per rep, with PDF and Excel reports.
- Reports: a weekly digest drafted by Claude for a person to review and send.
Dashboard screens shown with sample data.